

Built to Export, Priced to Lose?
Les rapports de marché ne paraissent qu'en anglais. Le reste du site est disponible dans votre langue.
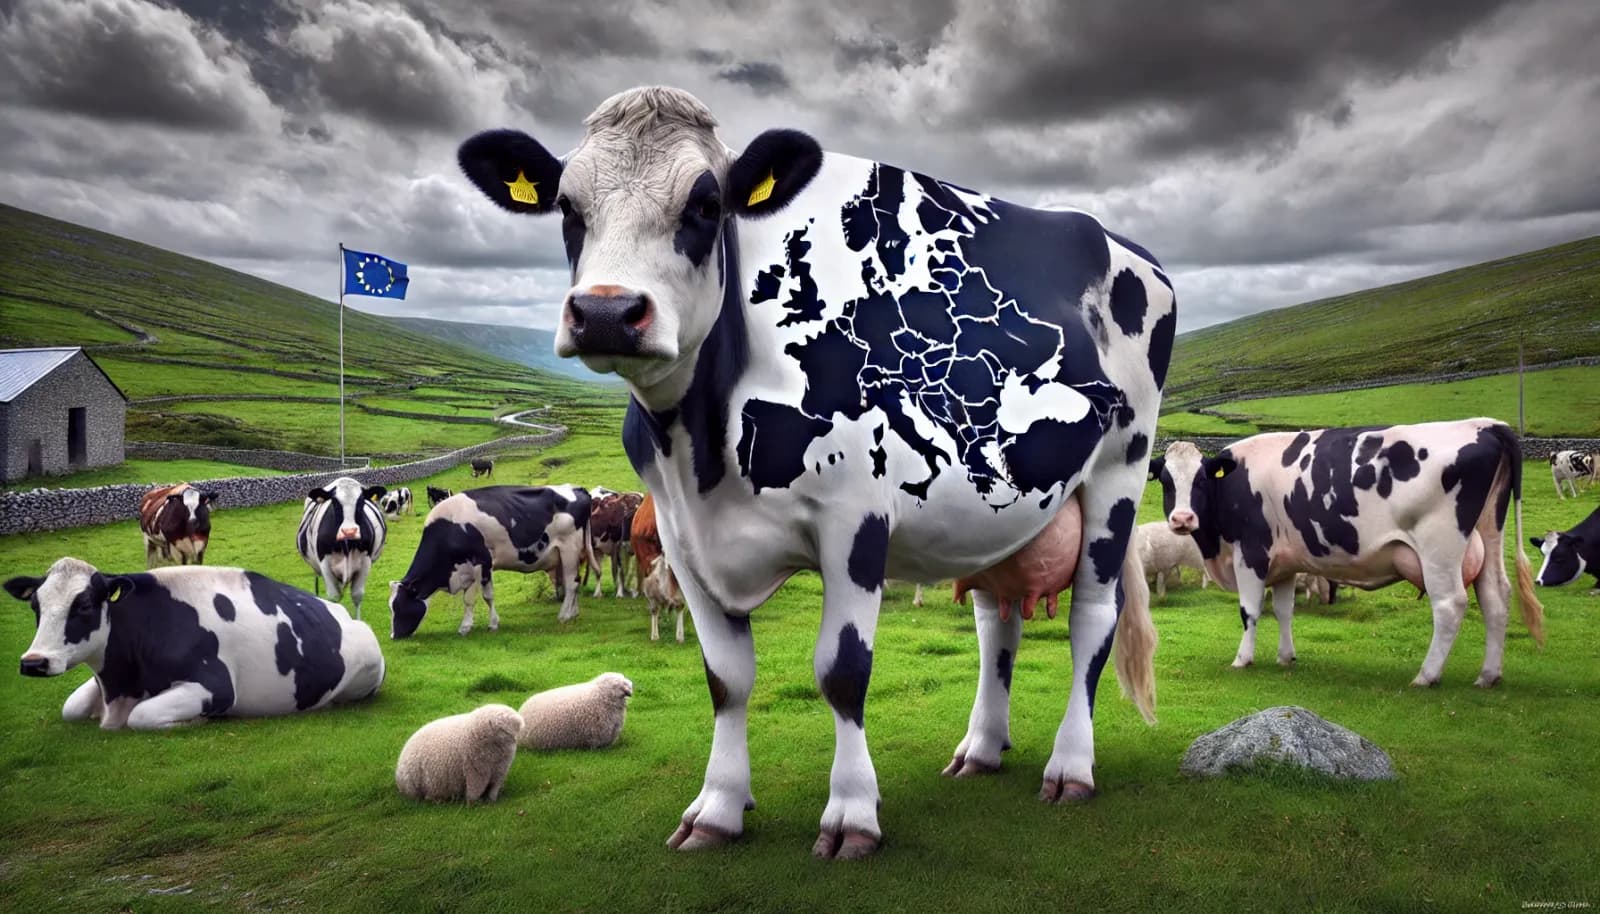
Last week was, yet again, another exercise in market mood swings: volatility, confusion, mild schizophrenia, and the usual heated WhatsApp group debates. Zooming out, dairy commodity prices have quietly shaved off 2–3% of their value over the past two weeks. Butter lost roughly €250/mt, cheese gave up around €150/mt, and powders—never one to miss a party—dropped just under €100/mt.
Milk production in the EU? The so-called spring flush hasn’t quite lived up to expectations. Let’s just say, it’s more of a drizzle. Dutch milk production seems to be improving a good bid with March volumes only 0.4% on 2024. But we dont see a big surplus EU wide yet. Favarable weather conditions might improve our outlook a bit. Demand, meanwhile, isn’t exactly roaring either. But the real pressure is creeping in from the export (and import) side. The recently imposed US tariffs have thrown a wrench into global trade, slowed export volumes, and—unsurprisingly—softened the USD, making American products cheaper and ours just that little bit harder to move.
This time no look at the EU day tot day market as we see buyers and sellers less and less convinced that taking action in such a unpredictable environment is wise. But we look at the EU export exposure risk. So, how dependent is the EU on exports, really? And which countries are pulling the most weight?
2023 EU Dairy Production vs. Export Volumes
We spent some time over the weekend digging through the data (don’t worry, we had coffee). With 2024 figures still patchy, we relied on solid 2023 stats for a more consistent picture:
| Commodity | Total EU Production (MT) | Exports (MT) | % Exported | Top 5 Destinations |
|---|---|---|---|---|
| Cheese | 10,600,000 | 1,379,100 | 13.0% | UK (110,569), US (54,241), Japan (53,909), Switzerland (34,369), South Korea (30,869) |
| Butter | 2,300,000 | 249,102 | 10.8% | US (59,859), UK (47,806), Saudi Arabia (16,182), China (13,983), South Korea (11,714) |
| SMP | 2,900,000 | 775,443 | 26.7% | Algeria (137,251), China (136,947), Indonesia (105,512), Nigeria (100,068), Philippines (94,263) |
| WMP | 2,900,000 | 260,327 | 9.0% | Algeria (74,018), Nigeria (34,446), China (32,111), Oman (29,445), Saudi Arabia (25,754) |
| Whey | 2,900,000 | 680,310 | 23.5% | China (140,607), Indonesia (118,773), Vietnam (110,714), Malaysia (89,381), Thailand (80,592) |
Clearly, SMP and whey are our "get-it-out-the-door" products—more than a quarter of production is shipped abroad. Compare that to WMP or butter, and you see where we’re most exposed. For context: in 2015, cheese exports were just 8% of EU production; butter export was a modest 5%. So yes, the EU has become more outward-looking—perhaps a bit too much.
Butter: Looking West—and Holding Breath
In 2023, EU butter exports to non-EU countries hit 249,102 mt. The big five exporters? Ireland (91,598), France (46,725), Denmark (28,383), Netherlands (23,992), and Belgium (15,399). Nearly 40% of EU butter is bound for the US and UK—so currency volatility and trade policy tantrums in these regions matter more than we’d like to admit.
Top Butter Export Destinations (2023)
| Rank | Country | Volume (mt) | Key Exporters |
|---|---|---|---|
| 1 | UK | 46,545 | Mainly Ireland (32,435) |
| 2 | US | 44,990 | Ireland (38,522), France (2,521) |
| 3 | Saudi Arabia | 16,184 | Denmark (3,079), Netherlands (784) |
| 4 | China | 14,041 | Germany (3,732), Netherlands (3,313) |
| 5 | South Korea | 11,739 | France (6,477), Poland (1,944) |
Add in a colorful mix of destinations like Bahrain, Israel, and Singapore, and EU butter ends up on plates across the globe—but make no mistake: it's the English-speaking world that sets the tone.
Cheese: UK and US Rule the Roster
Cheese exports tell a similar story. Out of 1.3 million mt in non-EU shipments, about 40% goes to the UK and US. But interest from Asia—especially Japan and South Korea—is steadily growing.
Top Cheese Export Destinations (2024)
| Rank | Country | Volume (mt) |
|---|---|---|
| 1 | UK | 432,820 |
| 2 | US | 126,489 |
| 3 | Japan | 101,880 |
| 4 | Switzerland | 71,220 |
| 5 | South Korea | 53,909 |
Gouda Focus (2023):
Total exports: 141,243 mt
Top exporters: Netherlands (85,649), Germany (35,474), Denmark (3,174)
Top destination: Japan (34,611 mt). Yes, Japan. Not the UK. Not the US.
Mozzarella, on the other hand, is going on a honeymoon with South Korea:
Top Mozzarella Destinations (2023)
| Rank | Country | Volume (mt) |
|---|---|---|
| 1 | UK | 73,602 |
| 2 | South Korea | 41,030 |
| 3 | Japan | 18,642 |
| 5 | China | 8,972 |
A Decade in Cheese Exports to South Korea and Japan (2013–2023)
| Year | South Korea (mt) | Japan (mt) |
|---|---|---|
| 2013 | 20,000 | 85,000 |
| 2020 | 55,000 | 120,000 |
| 2023 | 53,909 | 101,880 |
South Korea is still on board, Japan is losing interest showing the EU cant keep expecting export to continue to grow.
Powders: Where the Real Volumes Are
📈 SMP
Strong demand from Algeria and Asia
2023 Highlights:
-
Algeria: 143,288 mt
-
China: 68,246 mt
-
Egypt: 51,844 mt
📉 WMP
In decline. China’s self-sufficiency and NZ’s aggressive pricing haven’t helped.
2023 Highlights:
-
Algeria: 25,835 mt
-
China: 14,149 mt
-
Nigeria: 13,784 mt
🟰 Whey
Plateaued. Strong in feed and fitness, but growth is over.
2023 Highlights:
-
China: 201,759 mt
-
Indonesia: 73,198 mt
-
Malaysia: 71,460 mt
Currency Shifts: When Dairy Becomes a Forex Game
With the latest developments on the world stage where some friendships are lost and newones are made, currency shift are getting more and more important to look at. Because;
🇺🇸 Weaker USD:
- Makes US butter and cheese more attractive in Asia and MENA.
- EU exports to the US (~13% of cheese and butter) now face margin erosion—or worse, outright replacement.
🇬🇧 Weaker GBP:
- The UK is still our #1 customer across most categories.
- But if sterling stays soft and NZ/AUS continue tariff-free access post-Brexit, expect EU product to lose share—especially in value segments like mozzarella and cheddar.
Where the EU Is Most Exposed
We tried taking a look on where the EU is most exposed to loosing some export volumes.
| Product | % Exported | Key Risk |
|---|---|---|
| Cheese | 13% | UK (31% of all cheese exports), GBP volatility |
| Butter | 11% | US + UK = ~37%, tariffs + forex |
| SMP | 27% | High exposure to MENA/Asia, price competition |
| WMP | 9% | Demand decline, competition |
| Whey | 24% | Asia-bound, saturation risk, US competition |
Forward View (Q2–Q3 2025):
🧈 Butter
- Exports soft,
- Domestic demand flat
- Seasonal supply rising.
- Low stocks get replenished fast
- Imports are landing, supplying export-orientated factories like bakeries
📉 Outlook: Bearish unless tariffs vanish or demand surprises.
🧀 Cheese
- Gouda under pressure (Japan, UK, US exposure).
- Mozzarella facing competition from US and Oceanea exporters
📉 Outlook: Slightly more Bearish
🥛 SMP
- Demand is steady in Algeria, Asia.
- NZ/US pricing is the threat.
📈 Outlook: Stable, possible upside if Asia reorders.
🟫 WMP
-
Demand poor, competition fierce.
📉 Outlook: Bearish.
🧪 Whey
- Animal feed, wellness trends keeping it afloat.
- No real growth left.
📉 Outlook: Flat to bearish.
Final Thought:
The EU dairy market is entering what can only be described as a currency-sensitive chess match. Margins are thinning, trade alliances shifting, and buyer loyalty is, as always, up for auction. Powder looks like the most defensible ground—everything else? Hope you like tight spreads and longer sales cycles.
Plus du desk
Our Long View Before Our Long Break 
Our Long View Before Our Long Break
Last week the market found a bit of stability. After lower trades on cheese, the cheese market traded slowly up, although a real rally remains absent. Butter prices did dip a bit further, although at the start of this week we see some strength on the back end of the curve. And on powder, our bullish feeling just doesn't go away — and now we can find some confirmation in the market as well.
Dairy Carry Has a Shelf Life 
Dairy Carry Has a Shelf Life
Last week was bearish across the board — every product we broker leaned the wrong way. Powders lost more momentum, cheese slipped well below €3,000 for some products, and butter continues to impress with just how much keeps showing up. Supply, supply, supply.
Summer Shopping or Summer Sale? 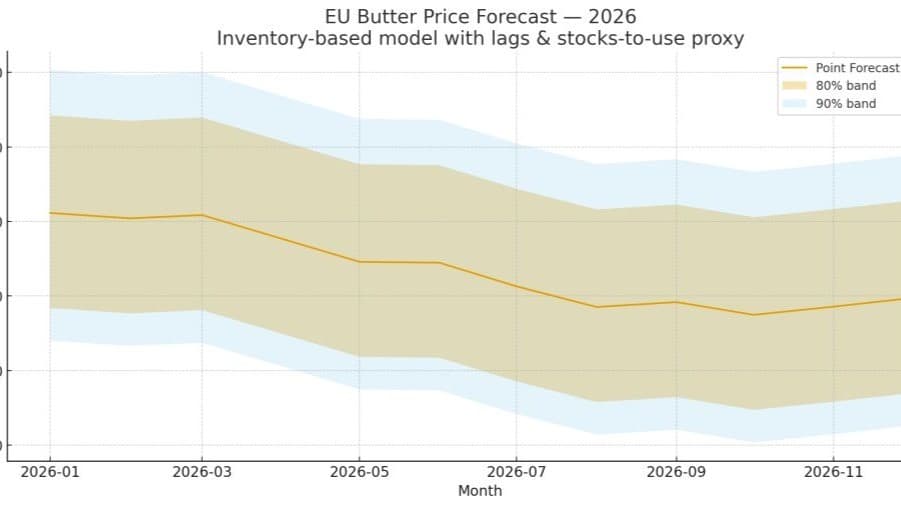
Summer Shopping or Summer Sale?
Last week was again a bit of a bearish week for the entire dairy industry. With cream prices under pressure and milk intake still strong, we keep seeing a market that has more supply than demand. Butter prices took another step lower, cheese prices cracked, and the powder market gave back a bit of its gains again.
Le rapport hebdomadaire
Recevez-le avant tout le monde
Chaque rapport de marché, dans votre boîte dès qu'il est écrit. Beurre, fromage, poudres, liquides — choisissez ce que vous négociez vraiment.
Environ hebdomadaire · Gratuit · Désinscription à tout moment