Confirmation Bias Bulls and Bears
Raporty rynkowe ukazują się wyłącznie po angielsku. Pozostała część serwisu jest dostępna w Twoim języku.

Last week was the first full trading week of 2025. And while nothing fundamentally changes just because the calendar flips, the psychological milestone of January 1 always hints at a possible pivot point. In reality, though, cows don’t suddenly start producing more milk, and aside from a few people starting the year avoiding alcohol, fats, and carbs, consumption doesn’t nose-dive either. Beyond any seasonal variations, the data driving market prices has already been shifting for months, or will only start shifting in the months to come. Over the last few days, we’ve talked to numerous data enthusiasts and noticed something intriguing: experts on both the bullish and bearish sides use the very same data to support their conflicting views. Today, we’d like to share some of these data discussions—and, of course, we’d love to hear your thoughts!
Because let’s be honest. Since Donald Trump entered the political spotlight, facts and figures often seemed less valuable. “Alternative facts” taught the world that truth isn’t always binary. Yet in the commodity markets, facts supposedly don’t lie. We all rely on the same data, and typically, we don’t question it. Or do we? While some have been debating the reliability of French Butter and Skimmed Milk Powder quotations for quite some time, in recent weeks the German quotation has also come under scrutiny. Heated arguments over “factual” numbers have even pulled the dairy world into this decidedly debatable reality. But there is more
Bluetongue: A True Bull Argument?
Last year, bluetongue was a hot topic, impacting milk production both short-term (less milk per cow) and long-term (fewer calves). A trading acquaintance recently sent us two images highlighting the virus’s spread, one from summer and another from late December. Our initial reaction was bullish: more bluetongue means more cows affected, which means less milk.
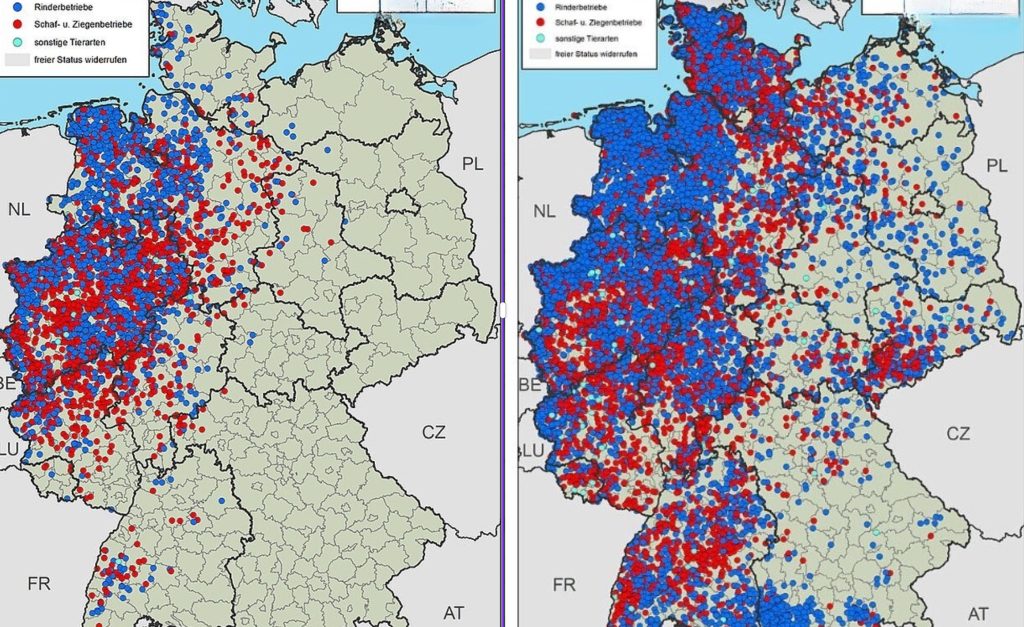
However, when we showed these images to our more bearish colleagues, they provided their own spin. Yes, there are more infected farms, but if the impact has already been reflected in milk collection data—and collection has still managed to keep pace with last year—then once bluetongue fades, milk output could only increase from here. And how did this map look like at the end of November? Or October? how much did the data change between those months?
Such a wide-spread blue tongue virus is concerning. Yet the bears might be right in thinking its effects explain Q4’s higher prices rather than guaranteeing a tighter milk supply in Q1. What is more concerning, we find the small outbreak of foot-and-mouth disease in Germany worrisome. It’s the first occurrence in years, and it appears all possible measures are being taken to prevent further spread. An outbreak of this disease could have a significant impact on the EU dairy sector wich no analist can spin bearish.
Exports: Increase Export on High Prices?
Here’s another fun tidbit that caught our eye: EU export data for butter during September and October. Even though prices were hitting record highs almost daily, export volumes actually went up. Bullish traders see this as proof the world keeps consuming fat, regardless of lofty price tags.
But again, the bears can flip it around: butter shipped in September was likely sold forward in May/June. At that time, NZ butter was trading considerably higher than EU butter, making EU butter competitive enough for export.
Underlying data shows France and Ireland boosted exports in those months, while Poland exported significantly less than the year prior. Polish suppliers tend to sell month-to-month, whereas French and Irish producers are more inclined to lock in forward contracts. So, the upcoming export data for November-December might paint a clearer picture of how robust export demand really was when EU butter prices soared.
Milk Collection: Zooming Out Often Helps
Then there’s the milk collection data we all pore over. We’ve seen different market participants be very selective in which data they highlight. Take the most recent numbers from Ireland, showing +14% and +33% more milk in October and November. Hardly a bearish sign. But are these figures as bullish as they first appear? They compare against one of the weakest October/November performances in recent history. Plus, October and November are relatively low production months. Show us +33% growth in April, and the impact becomes far more substantial.
In the US, it’s a different story. California milk collection is down 9% due to bird flu. California is a major milk-producing region, so 9% is significant. But if this drop was caused by a one-off event (and assuming cows recover), we shouldn’t expect a similar number in the coming six months. This data point, while it might appear bullish, might not be the structural change it first seems.
And we can’t forget one of our favorites: comparing overall milk volumes with total milk solids. We’ve noticed both bulls and bears latch onto whichever figure suits their narrative. Sometimes a country reports a -1% drop in milk collection, which sounds bullish for commodity prices. But it might turn out that total solids (fat and protein) were actually up 1%. The fact we’re collecting less water can overshadow the fact we’re collecting more solids, especially for those wanting to present only one side of the story.
We Do the Same
These are just three recent examples of data our colleagues have showcased to us this week. We’ve also received stock figures, consumption analyses, and weather forecasts—all aiming to bolster someone’s “correct” market view. Let’s be honest: we’re all guilty of the same thing. We strive for completeness, but inevitably, we focus on data that supports our own arguments. It’s a classic case of confirmation bias: we seek out information that makes us feel good about the decisions we’ve already made.
Our own market view? We’re bearish for butter and cheese, but a bit more bullish for powders (whey and SMP). We try to acknowledge bullish signals, but we’re also adept at dismissing the ones that seem weaker. We’d love to hear your perspective on butter, cheese, and SMP. Share your thoughts, and we’ll see how our network truly feels about the dairy market for 2025!
We start the day without any firm bids and offers as by the end of last week it seemed neither the buyers nor the sellers in our circle had any strong vision about either buyering or selling. Please send us. your bids and offers we can work with.
Więcej z parkietu
Our Long View Before Our Long Break 
Our Long View Before Our Long Break
Last week the market found a bit of stability. After lower trades on cheese, the cheese market traded slowly up, although a real rally remains absent. Butter prices did dip a bit further, although at the start of this week we see some strength on the back end of the curve. And on powder, our bullish feeling just doesn't go away — and now we can find some confirmation in the market as well.
Dairy Carry Has a Shelf Life 
Dairy Carry Has a Shelf Life
Last week was bearish across the board — every product we broker leaned the wrong way. Powders lost more momentum, cheese slipped well below €3,000 for some products, and butter continues to impress with just how much keeps showing up. Supply, supply, supply.
Summer Shopping or Summer Sale? 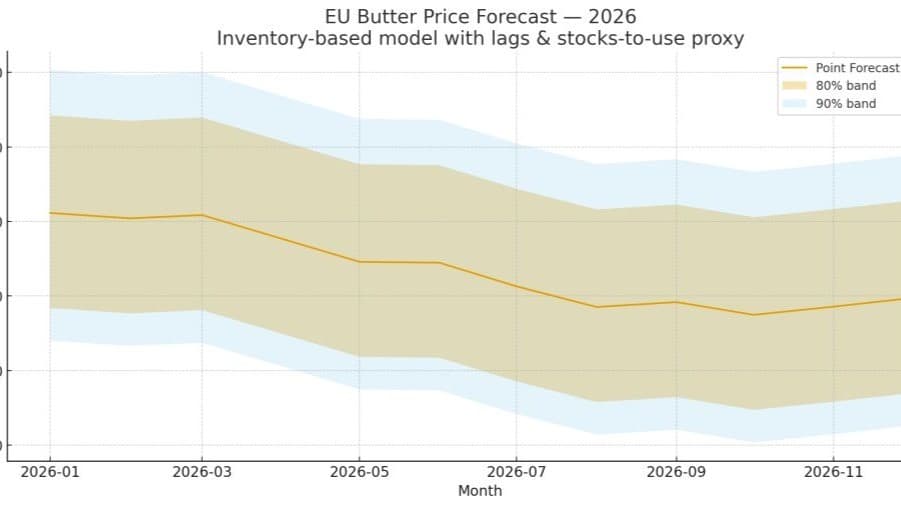
Summer Shopping or Summer Sale?
Last week was again a bit of a bearish week for the entire dairy industry. With cream prices under pressure and milk intake still strong, we keep seeing a market that has more supply than demand. Butter prices took another step lower, cheese prices cracked, and the powder market gave back a bit of its gains again.
Raport tygodniowy
Miej go, zanim trafi gdziekolwiek indziej
Każdy raport rynkowy prosto na Twoją skrzynkę, gdy tylko powstanie. Masło, ser, proszki, produkty płynne — wybierz to, czym naprawdę handlujesz.
Mniej więcej co tydzień · Bezpłatnie · Rezygnacja w każdej chwili